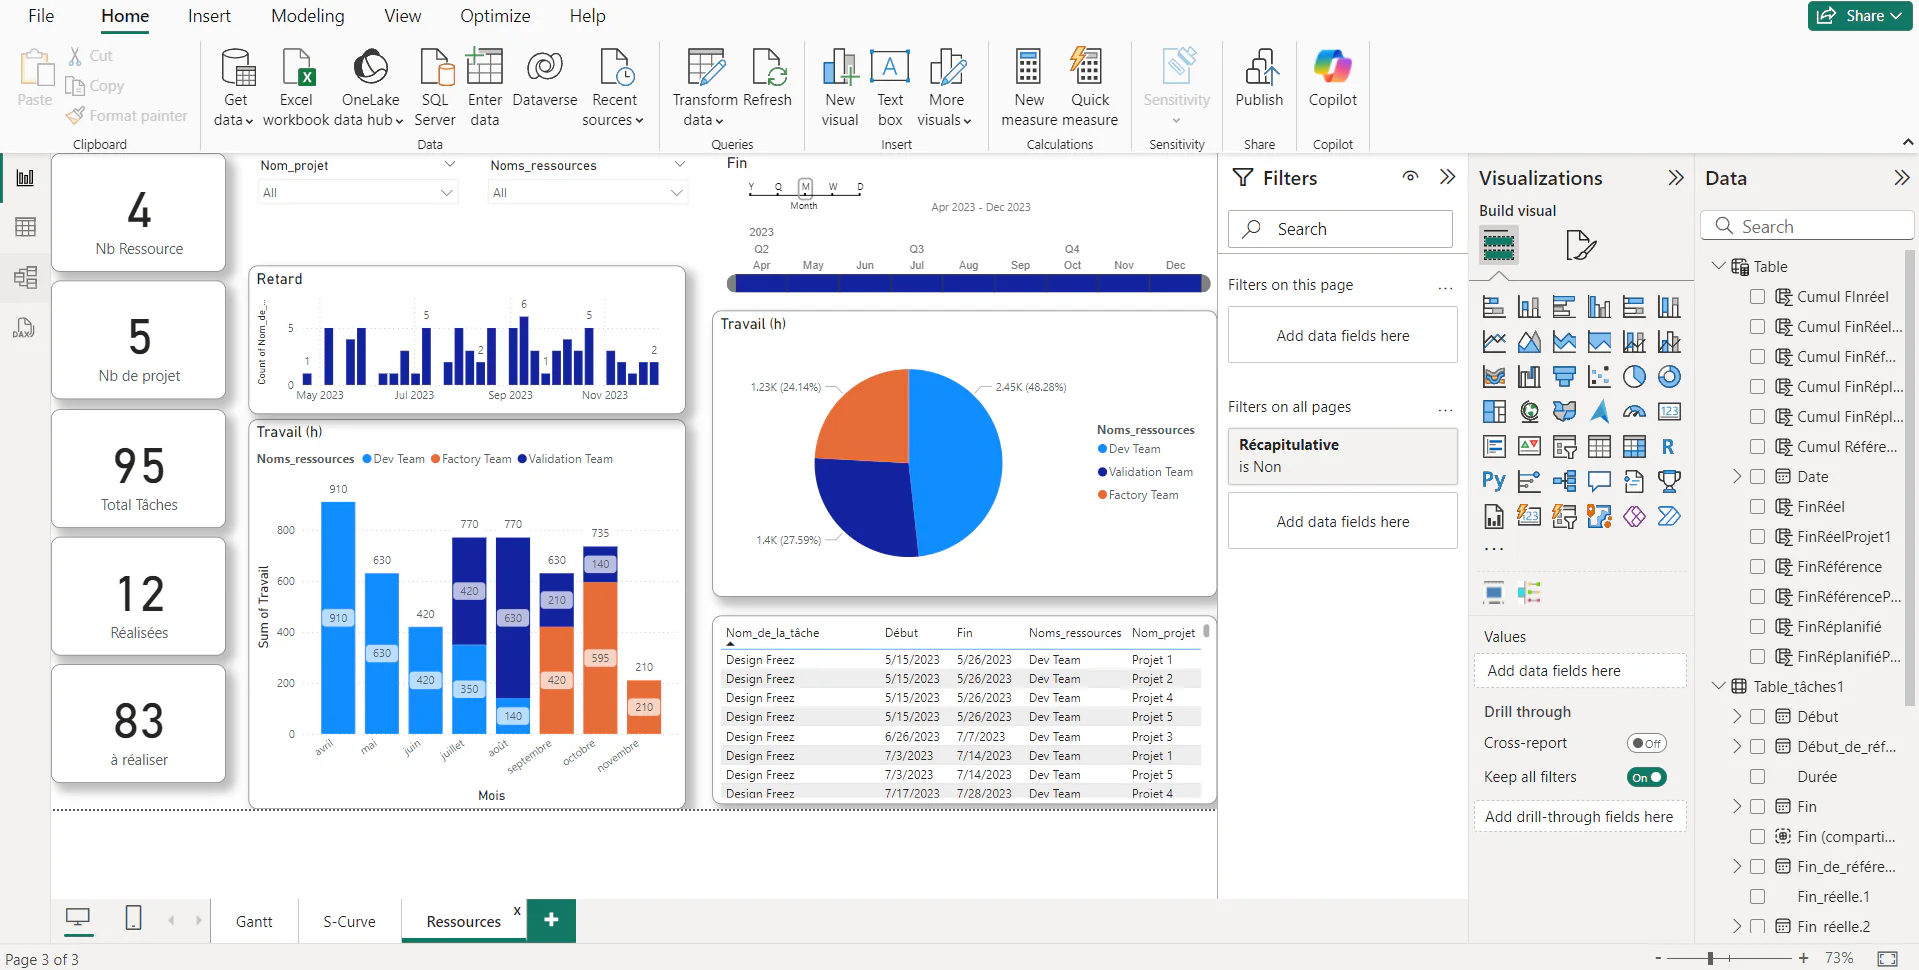
Course Overview
This hands-on Power BI Desktop course is designed for professionals seeking to enhance their data visualization and dashboarding skills. Learn how to connect to various remote data sources, transform and model data, and create dynamic visual reports in Power BI. This course covers essential techniques in data transformation, modeling, and visualization, enabling you to build insightful reports and dashboards for better decision-making.
Course Highlights
- Day 1: Introduction to Power BI, Power Query, and Data Transformation. Learn how to import data from various sources such as Excel, CSV, PDF, SQL, and web sources. Understand key concepts like query steps, merging datasets, and applying transformations.
- Day 2: Dive into data modeling techniques, including the creation of relationships, fact and dimension tables, and using DAX functions to build measures and calculated columns. Learn how to design dynamic visual dashboards with Power BI’s various visualization options and slicers.
By the end of this course, you will have the skills to connect, transform, model, and visualize data in Power BI Desktop, improving your data analysis and reporting efficiency.
Prerequisite
Familiarity with Excel, Power Query, and Power Pivot is helpful but not required.
